Sommaire
Preamble
The screen, a major link of the digital graphic chain, is the only visual element on which to rely to carry out the photographic work. If it reproduces the colors badly, it is all the management of the color which is badly done and the impression will bring bad surprises.
To calibrate its screen is a necessity, more especially as the existing solutions are cheap. The implementation of the épreuvage mode in lightroom 4 is a reason more to initiate with this practice which became an obviousness in the modern workflow.
In this article, we are particularly interested in the X-Rite probe and the i1 Display Pro. We will show you how to implement an ICC (International Color Consortium) profile thanks to its provided application, i1 profiler.
But before getting to the heart of the matter, we would like to remind you of two excellent references that will remind you of the fundamentals of calibrating a screen.
https://www.color-management-guide.com/how-to-calibrate-your-monitor.html
Slab typology
Three main categories of display panel compete for the market:
- TN panels, inexpensive, responsive, but with restricted viewing angles and rather poor brightness uniformity. Not recommended for photographers
- PVA panels, an interesting compromise for the photographer in terms of viewing angle and panel quality. Very good in video and less expensive than IPS panels.
- IPS panels, expensive, but ideal for photographers, with very wide viewing angles, very good uniformity of brightness depending on the model, less reactivity. These screens are not wanted by gamers.
In this article, we are calibrating a Dell U2711, 27 inch wide gamut IPS panel display, but any screen with standard gamut and with a TN panel can be perfectly calibrated in the same way. The results will obviously depend on the quality of the screen. Don’t expect to turn a low-end screen into a photo editing screen. Nevertheless any type of screen is often much better once calibrated and the difference could be more than spectacular.
Presentation of the probe
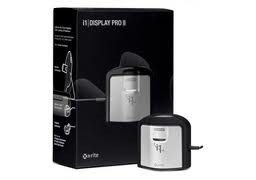
The i1 Display Pro probe comes with a complete software package; i1 Profiler. With this solution, the user will be able to carry out quality monitoring, a panel uniformity test, calibrate video projectors, wide-gamut screens, with LED or CCFL technology, laptop or Imac screens.
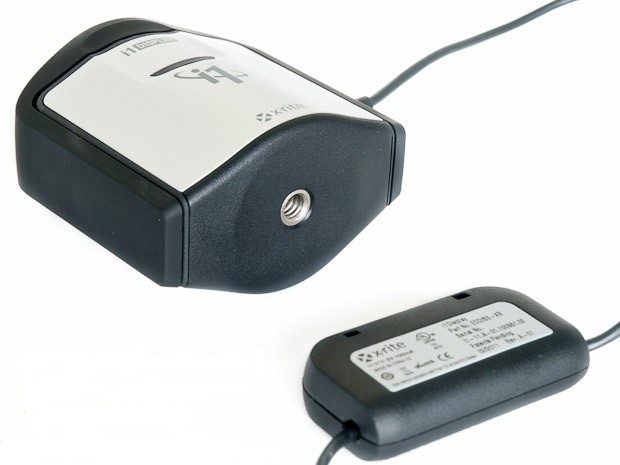
Figure 1 shows the probe and its counterweight which acts as a dongle. X-Rite, activate the license of its software using the dongle. It is therefore necessary to connect the probe to the USB port in order to activate the software.
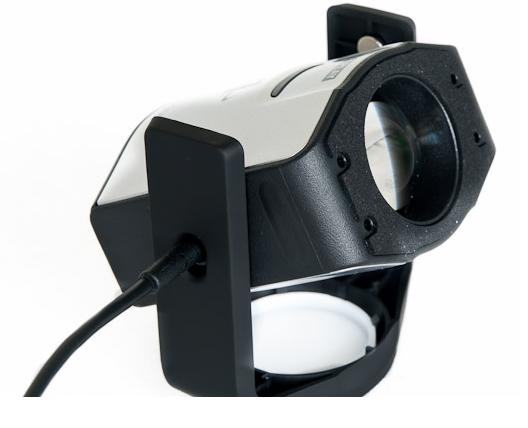
Figure 2 shows the device with a removable cover which is superimposed on the light sensor when the probe is not in use or when it is used to measure ambient light.
Calibration: Instructions for use
After installing, the calibration process takes place in two stages: profiling and characterization. We will see these two processes in detail later in this article.
The first thing to do is to reset your screen through the OSD menu to factory defaults. We invite you to consult the instructions for your screen in order to know the procedure. In most cases, the menu is clearly self-explanatory, simply navigate the interface using the function keys on the screen to find “factory settings” or “factory setting”.
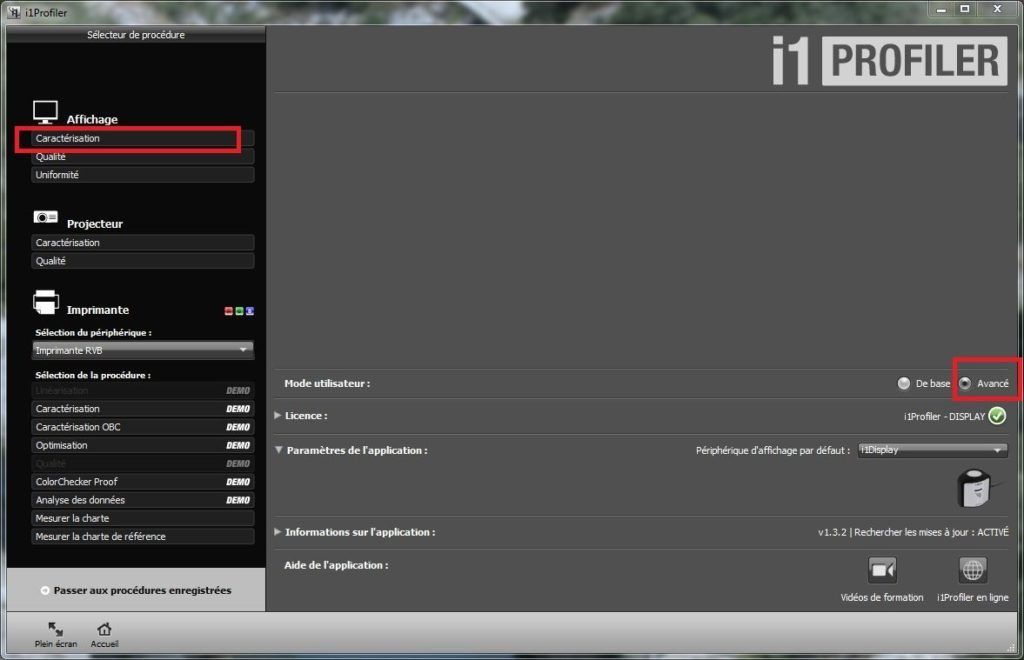
Launch the application. From the home screen you will notice that there are two user modes, we advise to activate the advanced mode in order to access the extended functions which we will see later.
The probe is automatically detected by the software. Note it is not be possible to launch a task without having connected the probe to the USB port.
The software is designed to calibrate printers, but what interests us first is the “characterization” in the menu displayed on the left. Click it in order to display the following window.
Profiling
We will define the operating conditions of the screen by setting its white point, its brightness and its contrast.
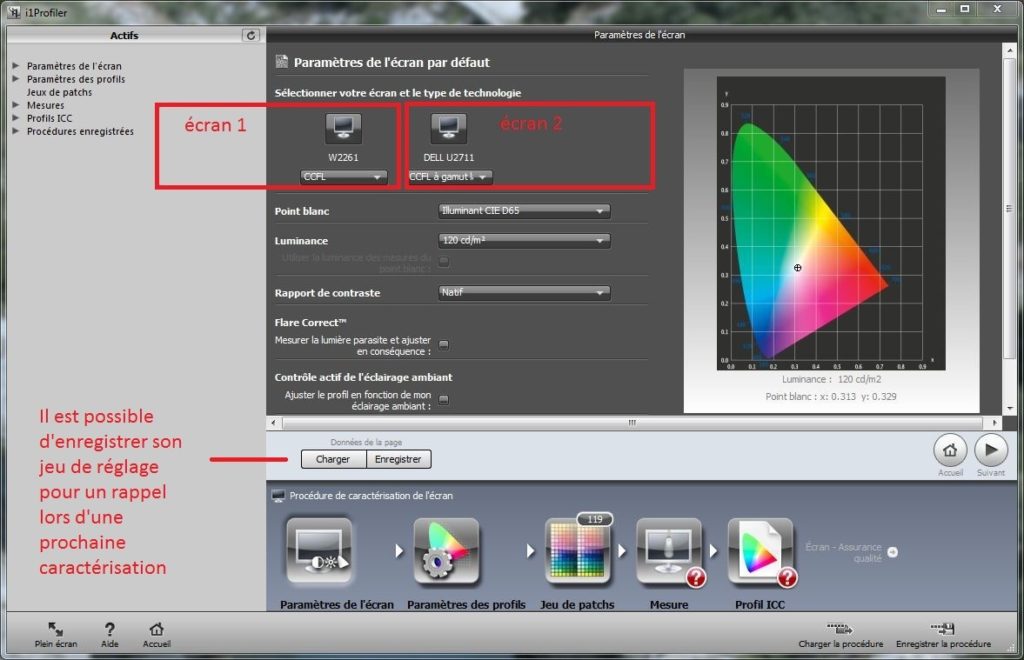
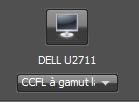
The following window gives access to the screen parameters. If you have multiple screens, they will appear distinctly. You must select the one you are calibrating by clicking on the corresponding icon and select the type of panel from the drop-down list below the icon, if the default choice is not correct. In the case of the Dell, we had to replace the option CCFL by “CCFL with wide gamut” (figure 5)
Next, the second parameter is the White point, expressed in degrees Kelvin. A list offers us several choices based on target illuminants (D50, D55, D65 and D75) or native (screen color temperature) or based on other values as shown in figure 6. We chose a standard value corresponding to daylight, i.e. 6500K (D65). If you print at home, it may be desirable to change this value to 5500K for example in order to take into account the whiteness of the paper.
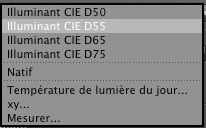
Note: The Measuring option allows the screen temperature to be adapted to the light conditions in your room. If we combine this measurement with the automatic measurement of ambient light for the correction of the profile in real time (figure 9), we have a real innovation. However, we have not tested this feature.
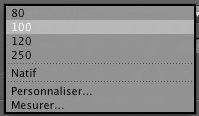
The third parameter is Luminosity, expressed in candelas per unit area. Figure 7 shows the list of target values. Once again, it is possible to customize the value you want, or to entrust the choice of the value by measuring the ambient light. In order to avoid having a too bright screen, a standard value of 120 CD / m² seems to be sufficient. It is possible to go down to 100 or even 80 CD / m² if you print at home. But in any case, it is important to realize that it is necessary to lower the brightness of a screen, especially if you are working in a dark environment.
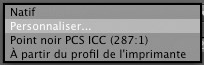
The next parameter is the Contrast. The software offers several options. In general, native contrast is a good choice. However, if you wish to harmonize several screens, it is possible to customize the value by retaining the lower of the two. Though, if the quality of the screens is different, this method would harm the best of both. It is also possible to extract the contrast ratio from the printer profile if you intend this screen for the only use of preparing paper prints.
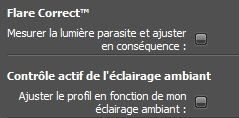
Two additional options allow you to obtain an even finer result (figure 9):
- The Flare correct allows stray light to be measured and corrected accordingly. This option is only necessary if you are working in an environment where spot light sources can interfere with the display, especially with brighter panels.
- Active control of ambient lighting is not necessary if lighting conditions are stable. The principle of this tool is simple: The probe remains plugged in at all times, and at regular intervals measures the ambient light and adjusts the profile accordingly.
Profile settings
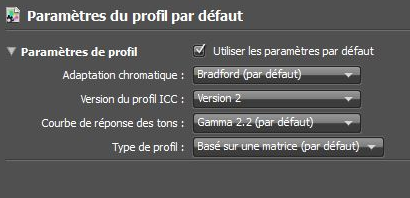
The figure above shows the example of a suitable set of parameters for the profile:
- The first parameter, chromatic adaptation must be left at its default value: Bradford.
- We recommend selecting the version 2 of the ICC profile, because not all current softwares support the version 4 of ICC profiles.
- The gamma parameter will obviously be left at its default value and it will rarely be useful, unless you work on a graphic chain where all the components are at a gamma of 1.8, or if your screen does not tolerate the setting of 2.2. As a general rule, this value is left by default. This is the value retained for the encoding of standard SRGB and Adobe RGB 98 spaces.
- The last parameter concerns the type of profile, the choice of the matrix method, the default value, offers very good results.
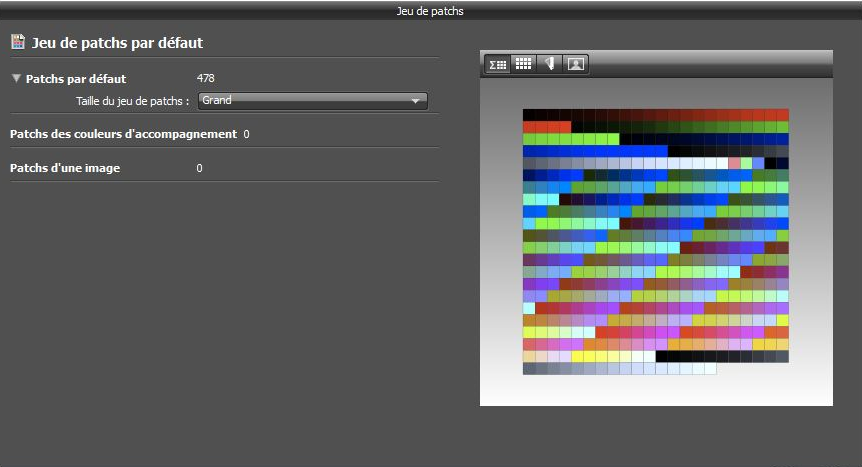
Patch sets
The next step is to define the set of patches that will be used to characterize the screen. The larger the clearance, the more accurate the calibration will be, but the longer the process will take.
The software allows you to add additional sets of patches from the Pantone Color Manager that can be found in the manufacturer’s bundle. For your personal use, we don’t think you need it. The choice of the patch set will depend on your panel. “Small” for a normal gamut panel and “large” for an extended gamut panel.
Characterization
The software will determine the “colorimetric signature” of the screen in its context defined previously, by sending to the screen a series of predetermined color palettes which will be measured by the probe and thus record the necessary corrections per color which will be recorded in a file. This process will also determine the color space of the screen.
The penultimate step is less obvious. In figure 11 bis, notice this checkbox “Automatic control of the ADC screen”. What is it?
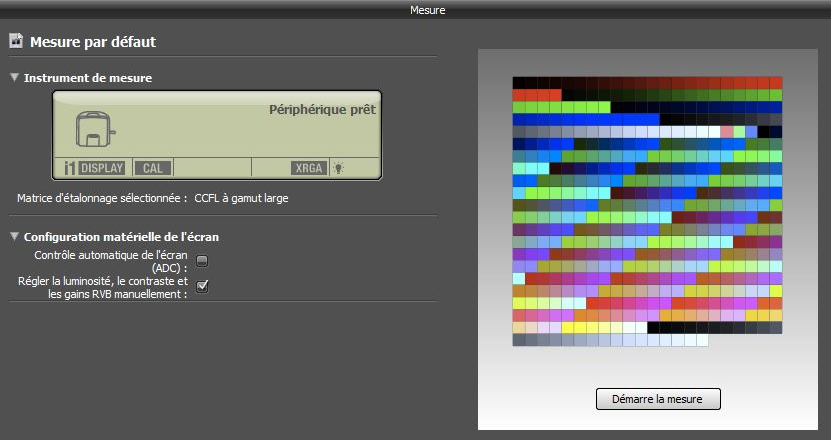
ADC is a function that will adjust your screen for you in order to tend towards the target values that you have predefined previously (120 CD/m² and native contrast). By adjustment, we mean that the software will intervene on the hard adjustment of your brightness and contrast sliders and RGB gains. This technology works quite well with so-called graphic arts screens. It seems that with the Dell screen used for this tutorial, this function is not very efficient and gives random results. Disable this function if your screen does not support it. We recommend to disable this function and manually intervene on the screen cursors.
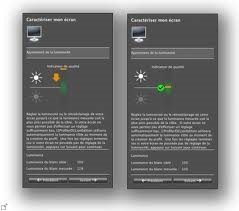
Indeed, once the measurement has been launched, you will be invited to intervene on the brightness slider. A gauge will appear and guide you until you reach the target value (figure 12). There will be no intervention on the contrast slider since you have chosen native contrast, that is to say the preset one. This is where it is important to understand the value of returning the screen to the factory setting values. As for the RGB gain sliders, don’t worry about it, you might be doing more harm than good trying to touch it.
Position the probe in the center of the screen, make sure that it is flat, then click on “Start measurement”. For a maximum color palette set, it takes 8 minutes.
As soon as the measurement is finished, you will be asked to put the cover back on the probe in order to measure the ambient light to effectively take into account the environment during its measurement phase.
If you have disabled automatic screen control (ADC), you will be prompted to manually adjust the brightness and contrast sliders from the OSD. Since we have chosen a native contrast, only the brightness slider will have to be adjusted (following figure).
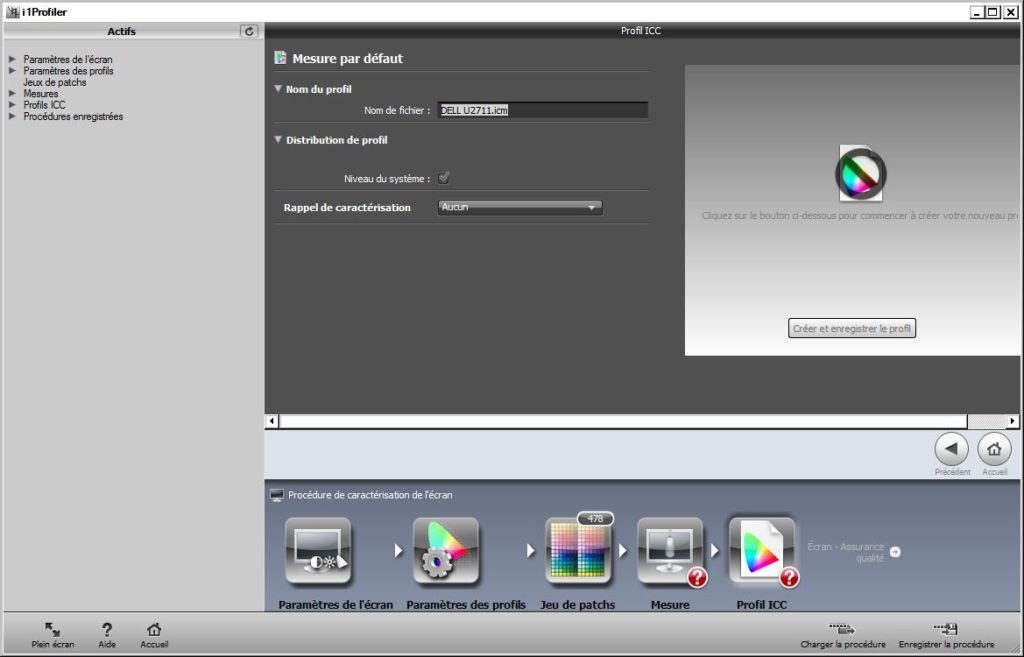
Profile registration
On the next screen, we rename our profile, we create and save the profile within the system. We checked the box which indicates that the profile is installed in the system automatically by the software. A characterization reminder can be configured from this screen. It is often advisable to perform a calibration once every two months.
Finally an important detail, at the bottom right you will notice two functions: “Load the procedure” and “Save the procedure” (figure 13). The software allows you to save the entire calibration procedure you have just done in a .dwxf file. If for any reason (bad handling, attribution of a bad profile, etc.) you can reload the procedure and re-register the profile in the system, thus avoiding a new calibration.
Quality control and monitoring
At the end of this calibration the i1 profiler allows you to qualitatively assess your profile thanks to a set of color palettes which will be used to assess the difference between the theoretical color of this color palette and that obtained in your profile.
There are two methods of accessing quality controls:
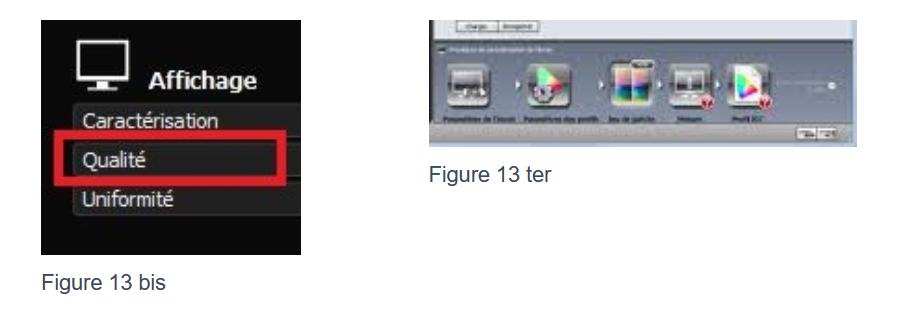
- Via the welcome screen, you will launch the task by clicking on quality (figure 13bis)
- By clicking on the text of the lower banner (figure 13 ter)
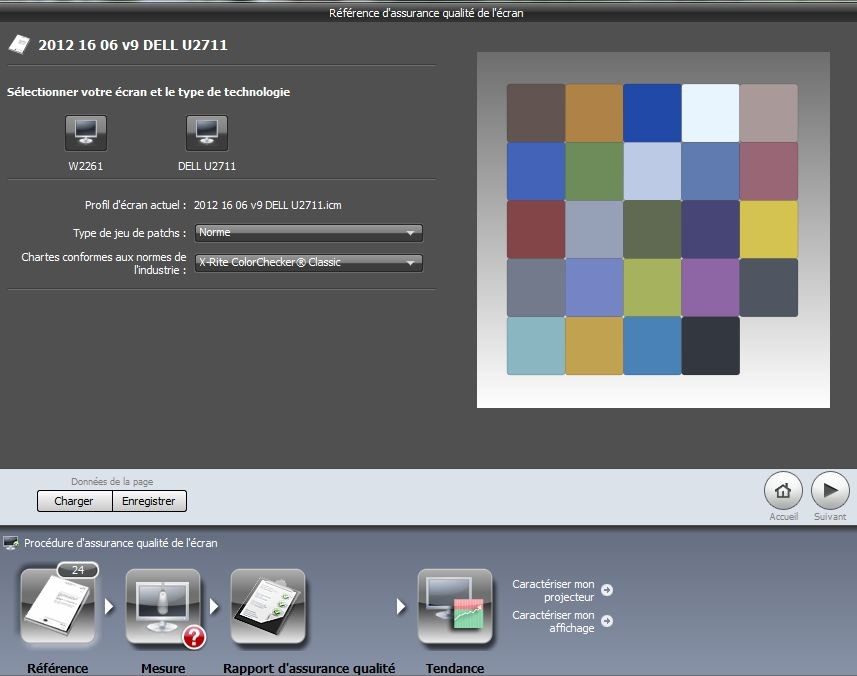
From this screen, select the monitor for which you are testing the profile. We will base this test on the X-Rite Colorchecker Classic. You can, once again, save the tuning set for later use. Click on the next button to continue the measurement procedure which is very fast.
Results
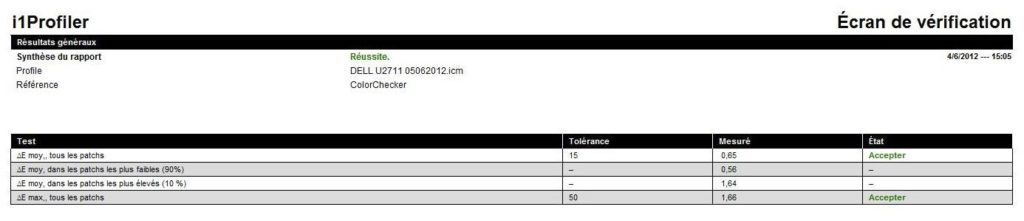
The professional version provides a complete record. FIG. 16 illustrates the result with a representation of a 24 color patch in which each color patch is divided into two parts: the upper part represents the approximate color obtained by the screen and the lower part that of reference. The left part of the screen summarizes the differences, expressed in DeltaE, which separate the measured colors from the ideal colors. Thus, thanks to a threshold which is determined by the DeltaE3 index, the reference value, the quality assurance report accepts or rejects the measurement. In the following figure the part circled in green shows that the result is accepted.
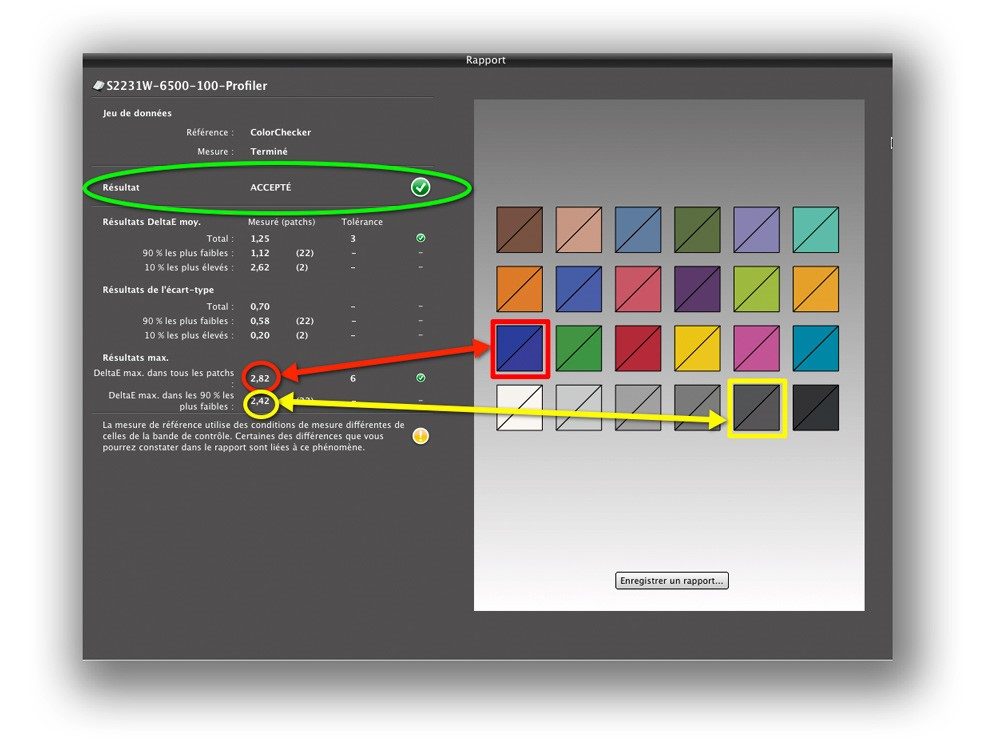
Figure 16 gives you an overview of the result that can be obtained with a DELL U2711 screen and this probe. We would like to point out that an average delta of 0.65 and a max delta of 1.66 are exceptional compared to the price of the screen (620 euros) and the probe (190 euros). This report is generated from the “save report” command in figure 15 bis.
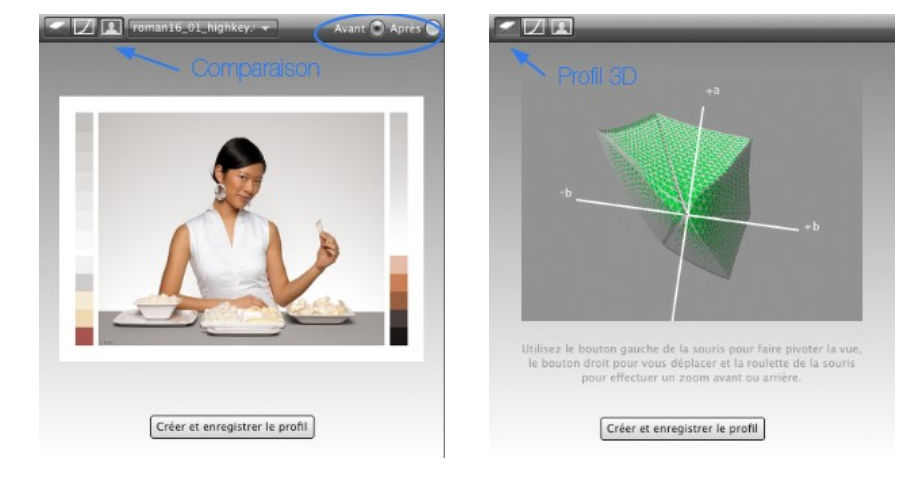
At the end of the calibration, the user accesses the quality trend monitoring over time in the form of a point curve, a before / after preview in order to assess in which color range the corrections have been most important, and the height of refinement, of an interactive 3D graphic representing the ICC profile in the LAB reference color space. The visualization of these results goes through the tabs of the result window.
The images below illustrate what the software provides in terms of profile control.
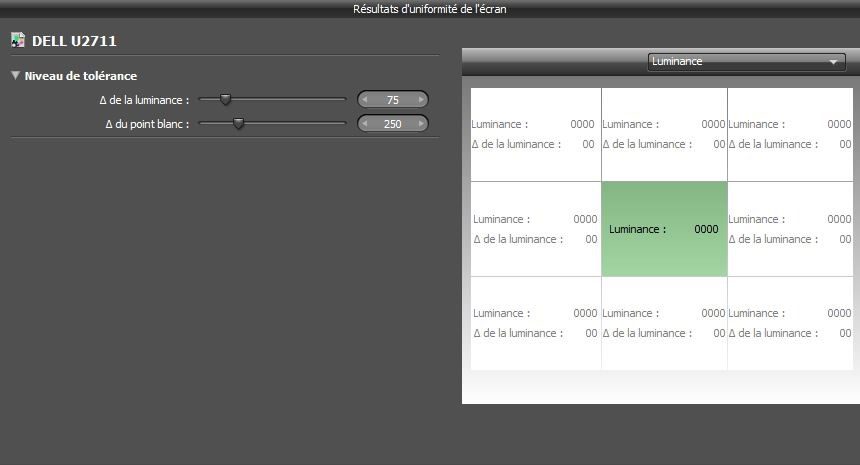
Brightness uniformity test
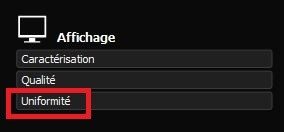
The last part of the article is devoted to the test of brightness uniformity of the panel. This test measures the white point and the brightness of the screen in 9 zones. With TN type panels, you will quickly understand the extent of the problem. To run this test, you will select the “Uniformity” option from the home screen.
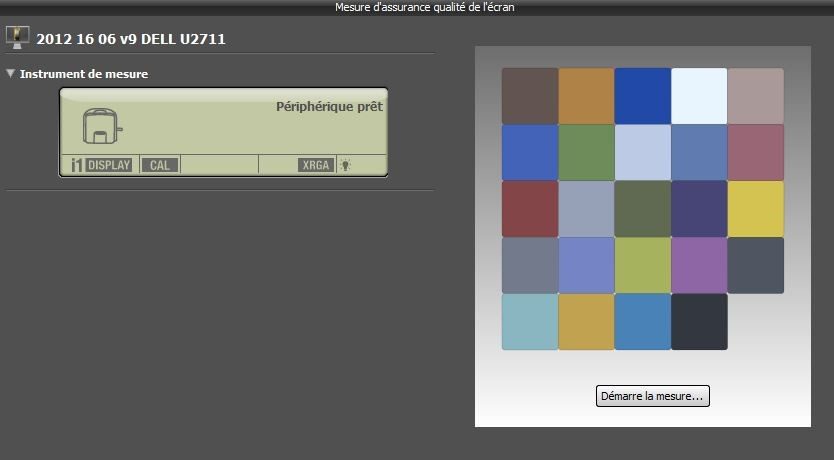
After selecting the screen, then preparing the probe, launch the measurement (figure 18).
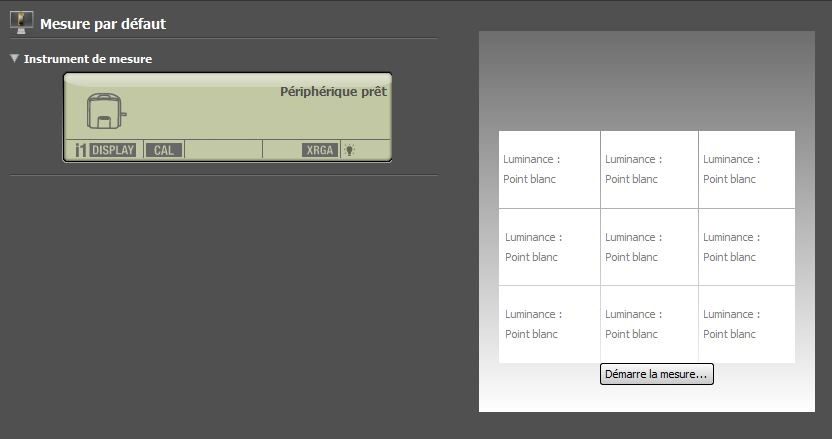
Place the probe on each zone predefined by the software, then follow the guided tests. At the end of this measurement, the result obtained is displayed in the form of a matrix of patches with the various values measured in luminosity / white point and the difference in luminosity / white point of each of the zones compared to the center.
As we couldn’t find any clear information on this, we are assuming it’s the delta between the center and an edge. Figure 19 illustrates this result. The top tab toggles from brightness to white point. On the left of the screen, we find the tolerance setting of the luminance / white point deviation which will serve as the threshold for the acceptance of the measurement.
To conclude
Often, our eyes are used to the standard settings that shine and calibrate a screen sometimes brings disappointment. Some find it bland, lifeless. Guy-Michel said “It’s a bit as if, every morning, you put ten sugars in your coffee; the day you are told that one would be enough, the coffee seems bad to you. “
We had this feeling with the low light which had come down to 13, but after a few days you get used to it.
The experience is really worth trying as the result is good. Look at the difference between the theoretical colors and the colors of the screen. For less than 200 euros, you get a professional result. Remember that the weakest link in your digital editing flow will condition the result of your final work.
Article written by Cyril Beaudron
Translated by Gautier Andreotti
TuToDxO.com – All rights reserved – tous droits réservés.